INTRODUCTION TO GEPHI
Social network analysis and visualization in Gephi
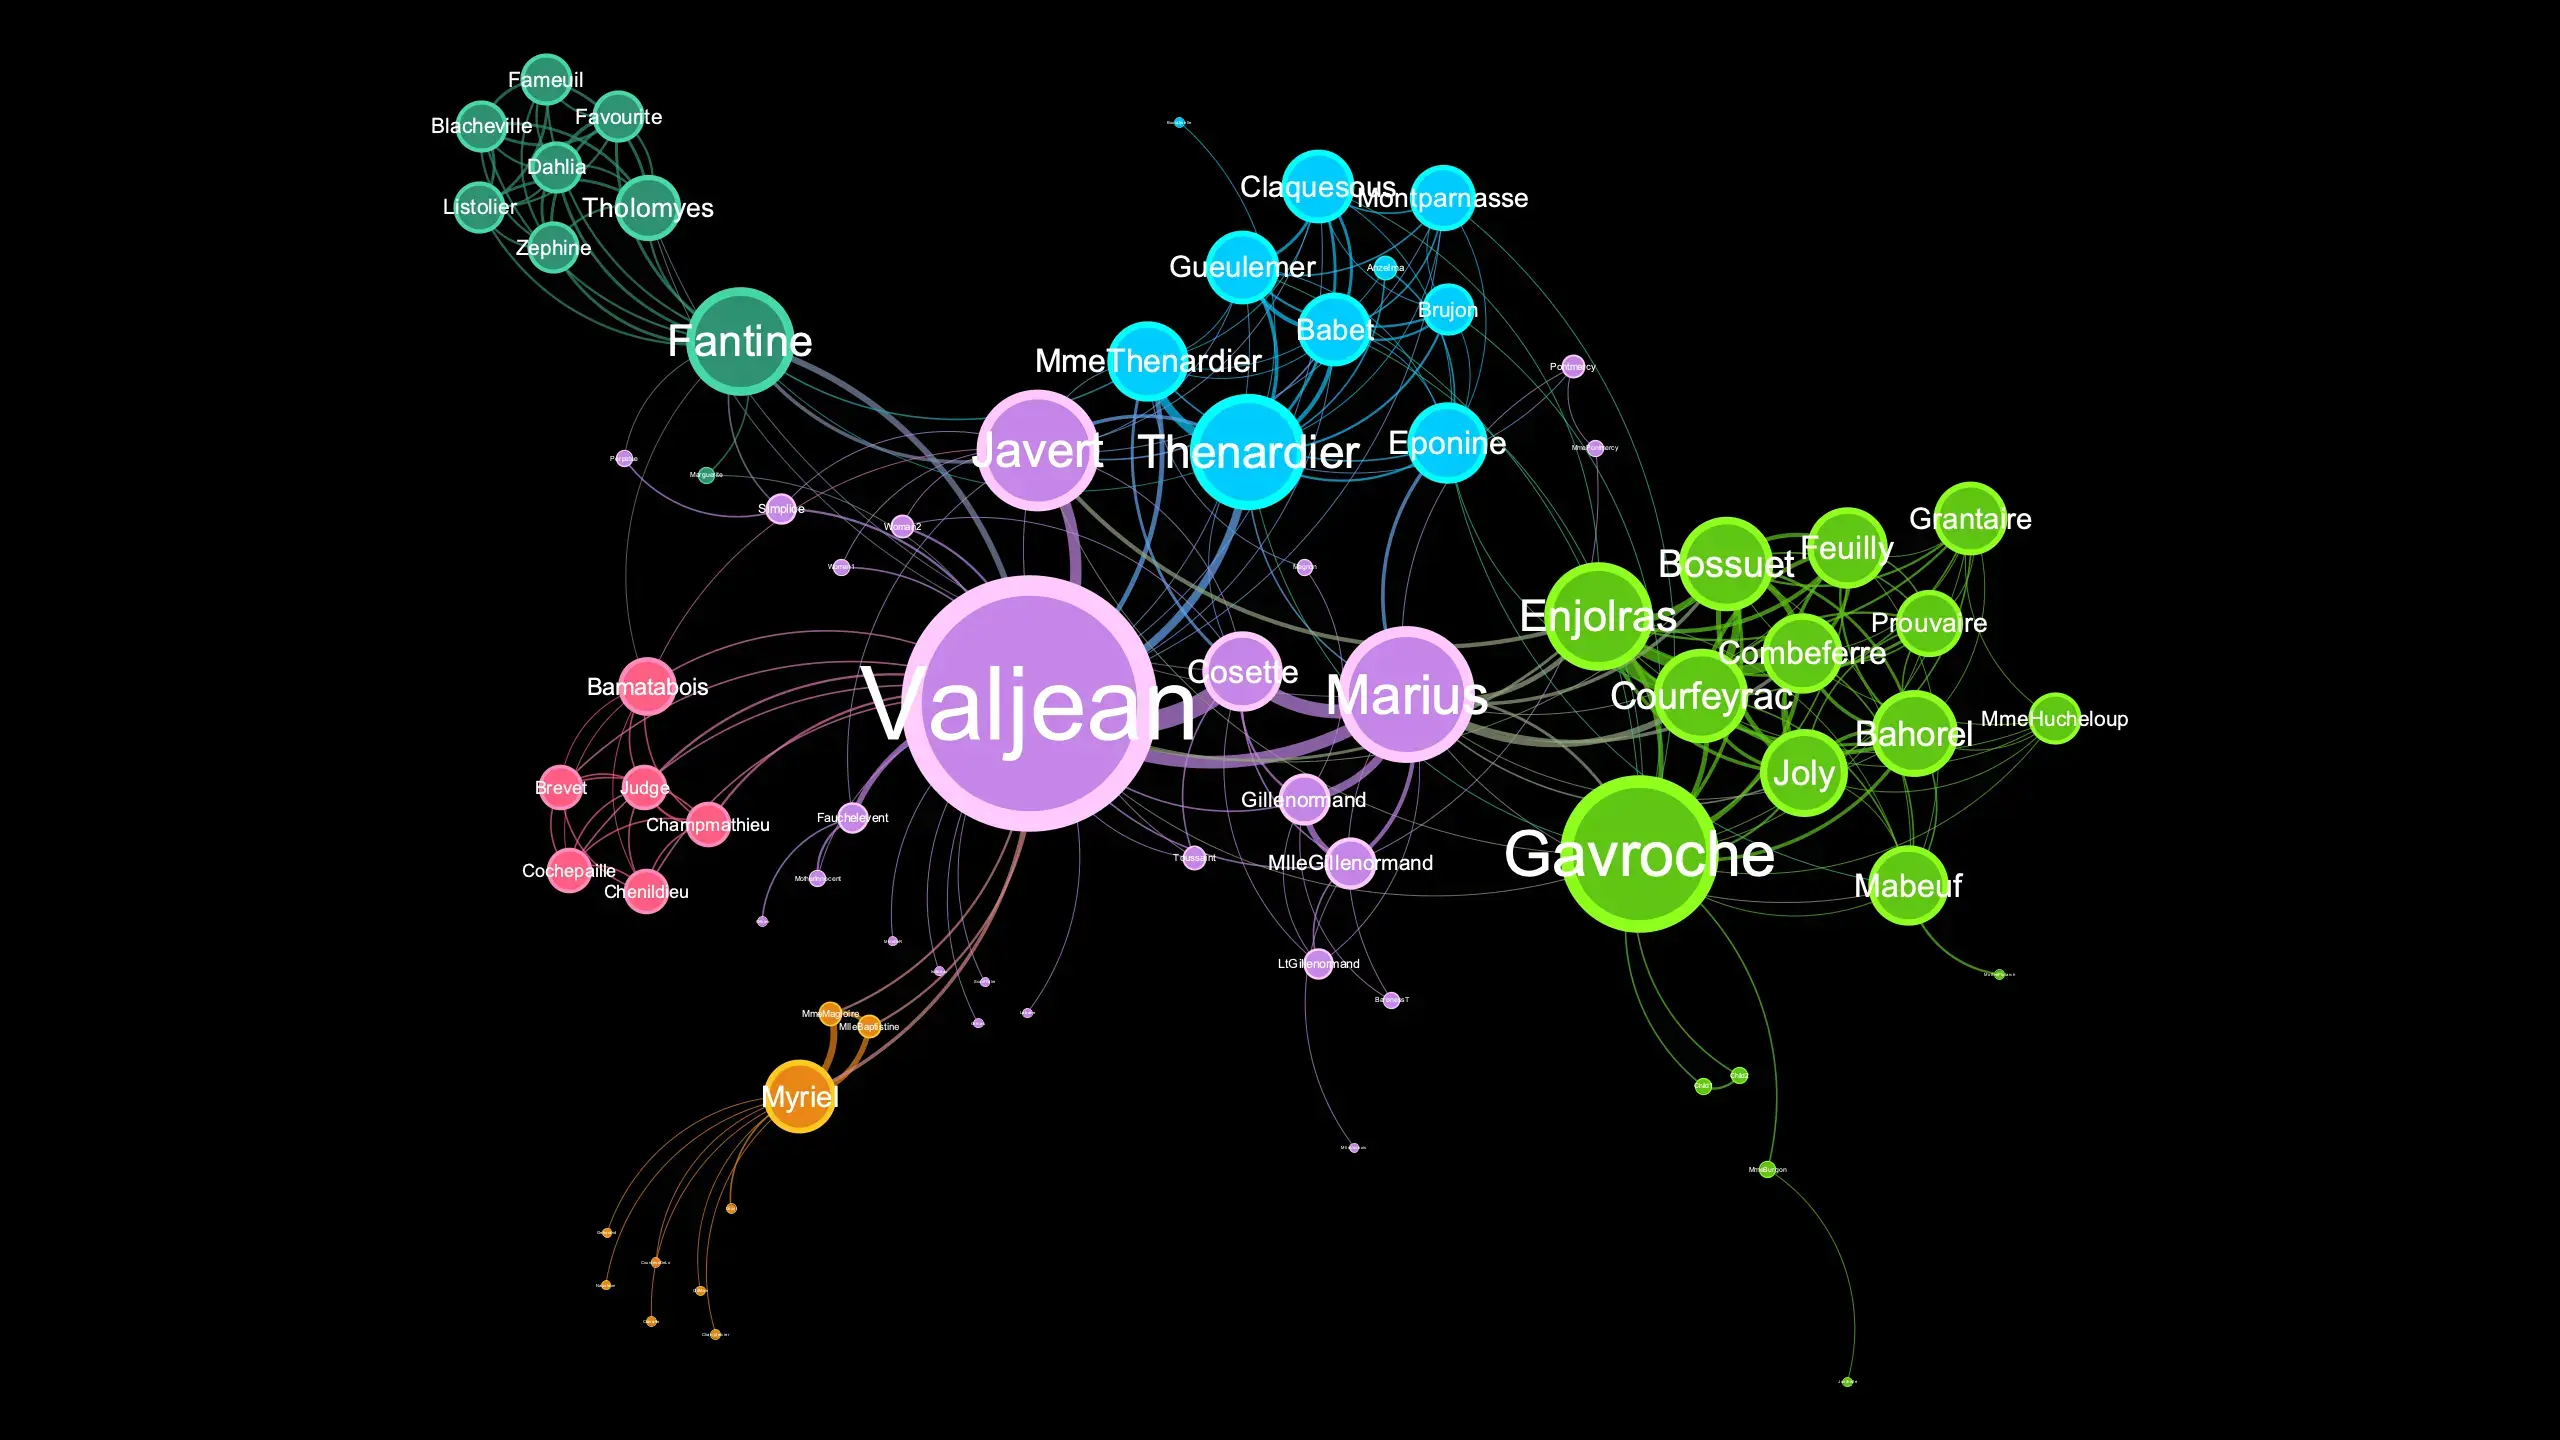
Gephi is one of the most widely used tools for Social Network Analysis (SNA). It’s completely free, and it has most of the features you need for network analysis and visualization. In my experience, the high-quality images that you can produce in Gephi make it perfect for research and publication. As with any desktop-based application, there are limited options in Gephi for custom visualization. Nevertheless, it is still one of the best options around if you are starting out with SNA.
For this demo, we will use the dataset from the Networking the New American Poetry project. The researchers gathered bibliographic data from the mid-twentieth-century little magazines associated with poetic schools in Donald Allen’s The New American Poetyr: 1945-1960.
In this blog series, we will create network visualization of these little magazines using Gephi, focusing on the following steps: generate and design network visualizations; use different network layouts for rendering visible the network structure of poetry communities; identify the important actors in the field using centrality measures; filter data points and partition sections of the graph to explain our insights; finally, cleaning and restructuring the original dataset into Gephi-readable files. Hopefully, these demos will show you the process from the beginning to the end.
This is not a tutorial. Meaning, I won’t cover each and every functionality Gephi offers. There are already many tutorials and walkthroughs that cover it in detail, including the ones by the Gephi community. The aim of this blog series is to show you the workflow so that you can start your own projects.
Setup
You will need the following things to follow along:
- Gephi: Download and install it on your computer.
- Working Folder: Download the working folder automatically from Github. If you prefer to download individual files, you can visit the Github repo.
- Spreadsheet: Microsoft Excel or something else (I use ONLYOFFICE). Because the working folder contains all the files you need to start working with Gephi, you can complete the core demos without it. However, you will need it for the data wrangling section and for working on your own projects.
Once you have installed Gephi and downloaded the working folder, head over to the next post to begin.