CENTRALITY
Centrality measures in Gephi
In our previous post, we used Yifan Hu, a clustering algorithm, for rendering communities visible. In this post, we will use centrality measure to identify the important nodes in the network.
Step 1: Install multimodal networks transformation plugin
- Make a copy of the yifanhu.gephi file and rename the copy betweenness.gephi.
- Open Gephi and select this file.
Let’s install the Multimodal Networks Transformation plugin.
- In the menu bar on top, click Tools > Plugins.
- In the Plugins dialog box, select Available Plugins tab, find Multimodal Networks Transformation plugin and install it.
Our network graph has two dimensions, journals and poets. A centrality measure computes the centrality of a node relative to all other nodes in the graph. Since a journal node will have a higher degree of connections than a poet node, our centrality measure will be skewed in favor of the journal nodes. In order to level the field, let’s convert our bimodal graph (journal-poet) to a unimodal graph (journal-journal).
Step 2: Convert the bimodal graph to a unimodal graph
- Select the Multimodal Networks Trasformation tab, the panel on the right (fig. 1).
- Click Load Attributes > select Attribute type: type String > Left matrix: journal–poet > Right matrix: poet-journal.
- Check Remove Edges, Remove Nodes, and Proportional.
- Click Run.
- Click Center the graph (magnifying glass).

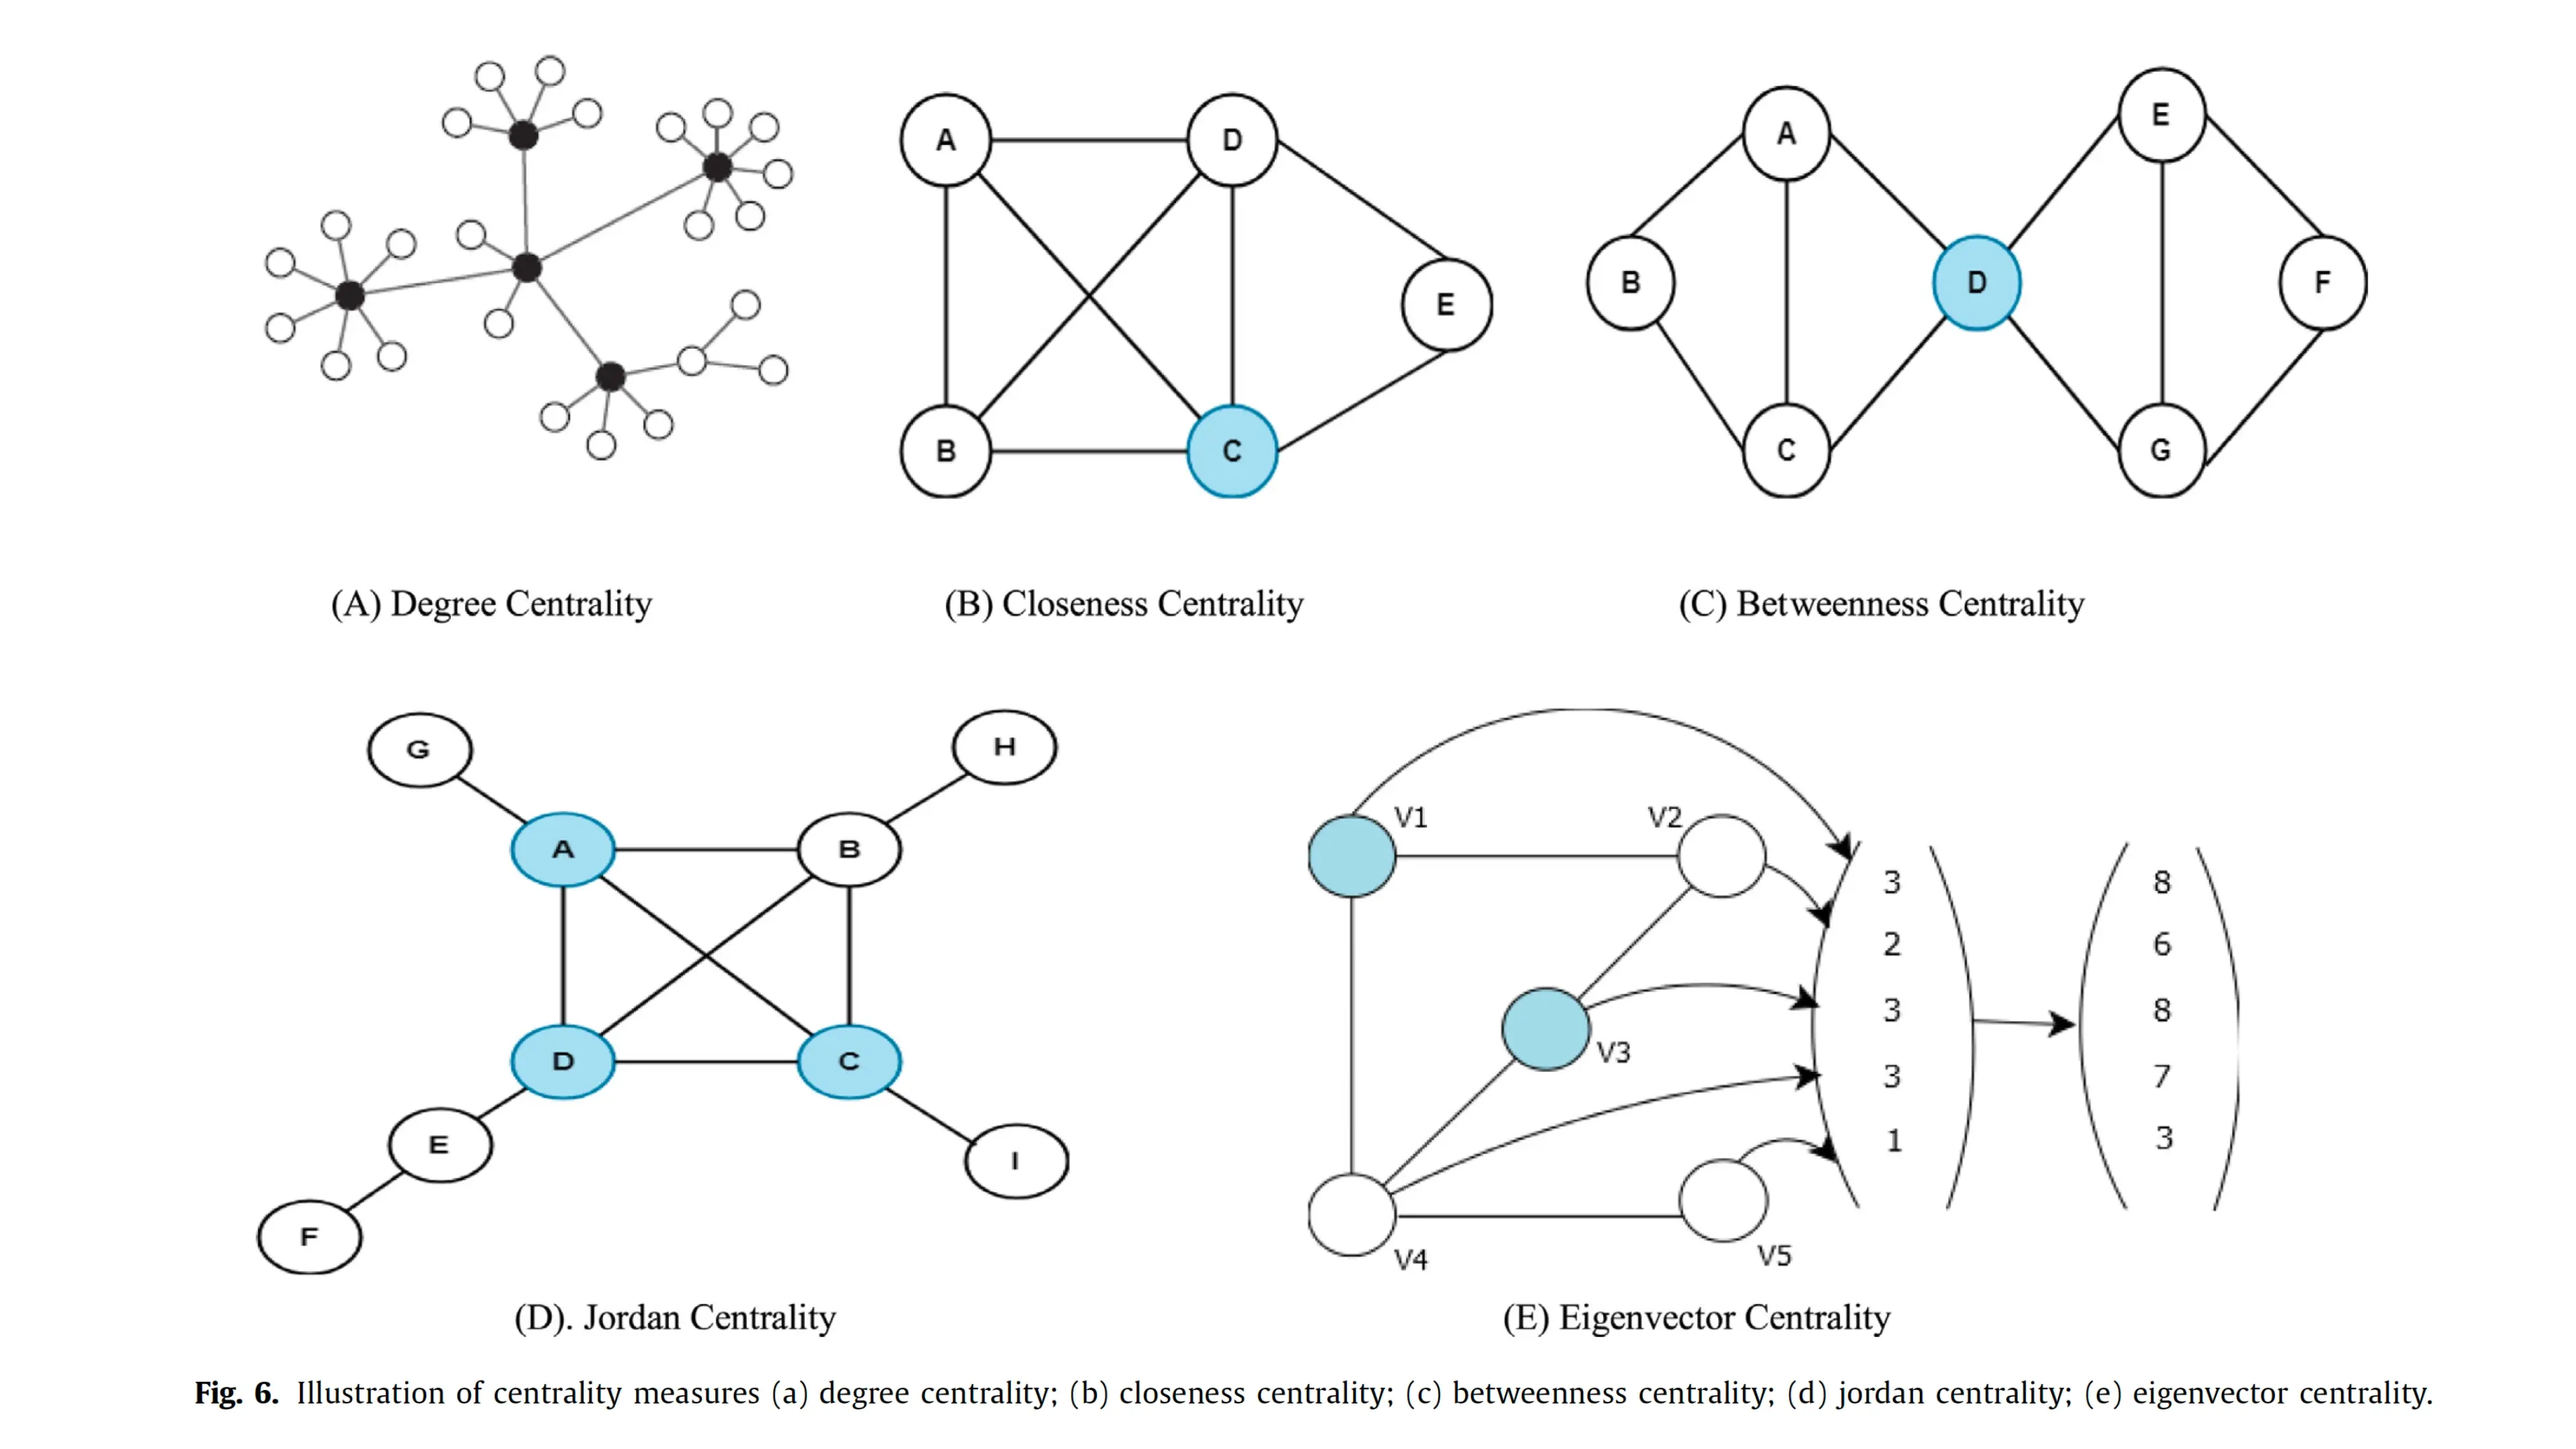
Next, we will calculate betweenness centrality for each node. A node has high betweenness, compared to other nodes, if it is positioned between two or more unconnected nodes. In other words, in order for something to “flow” between nodes or between communities, this node with high betweenness acts as an intermediary.
Step 3: Betweenness centrality
- Go back to the Statistics tab (fig. 2), and Run the Network Diameter. In the Graph Distance Settings dialog box, check Normalise Centralities. In the HTML report dialog box, click Close.
We will change the node size, node color, and node label size based on this measure.
- Change node color: In the Nodes tab, select Color (color palette icon), then Ranking > Choose an attribute > Betweenness Centrality > Apply.
- Change node size: In the Nodes tab, select Size (ring icon), then Ranking > Choose an attribute > Betweenness Centrality > Min Size 20, Max Size: 120 > Apply.
- Change label size: In the Nodes tab, select Label size (TT icon), then Ranking > Choose an attribute > Betweenness Centrality > Min Size 2, Max Size: 3 > Apply.
- Save the file: File > Save.

Let’s export the image
Step 4: Export the image
- Go to the Preview tab, and under Presets, select demo. Go to the Export option at the bottom left of the screen, click on SVG/PDF/PNG. Change image settings: Click on Options… In this dialog box, change Width 2560 > Height 1440 > Ok. Save the image in the begin folder: Save In > gephi-intro folder > begin folder > Files of Type: PNG files > File Name: betweenness.png > Save.
The final result looks like this (fig. 3). We can see that the nodes with high degree centrality, i.e., higher number of connections—Origin, Beatitude, and Intrepid (fig. 1)—are not the important nodes because they lie on the periphery of the graph, and they do not position themselves as intermediaries. On the other hand, Evergreen Review has low degree centrality (fig. 1), but it has high betweenness centrality (fig. 3), which makes in an important actor in the field. Go back to the Overview tab and hover over the Evergreen Review node to see its connections as well as its position between nodes.
