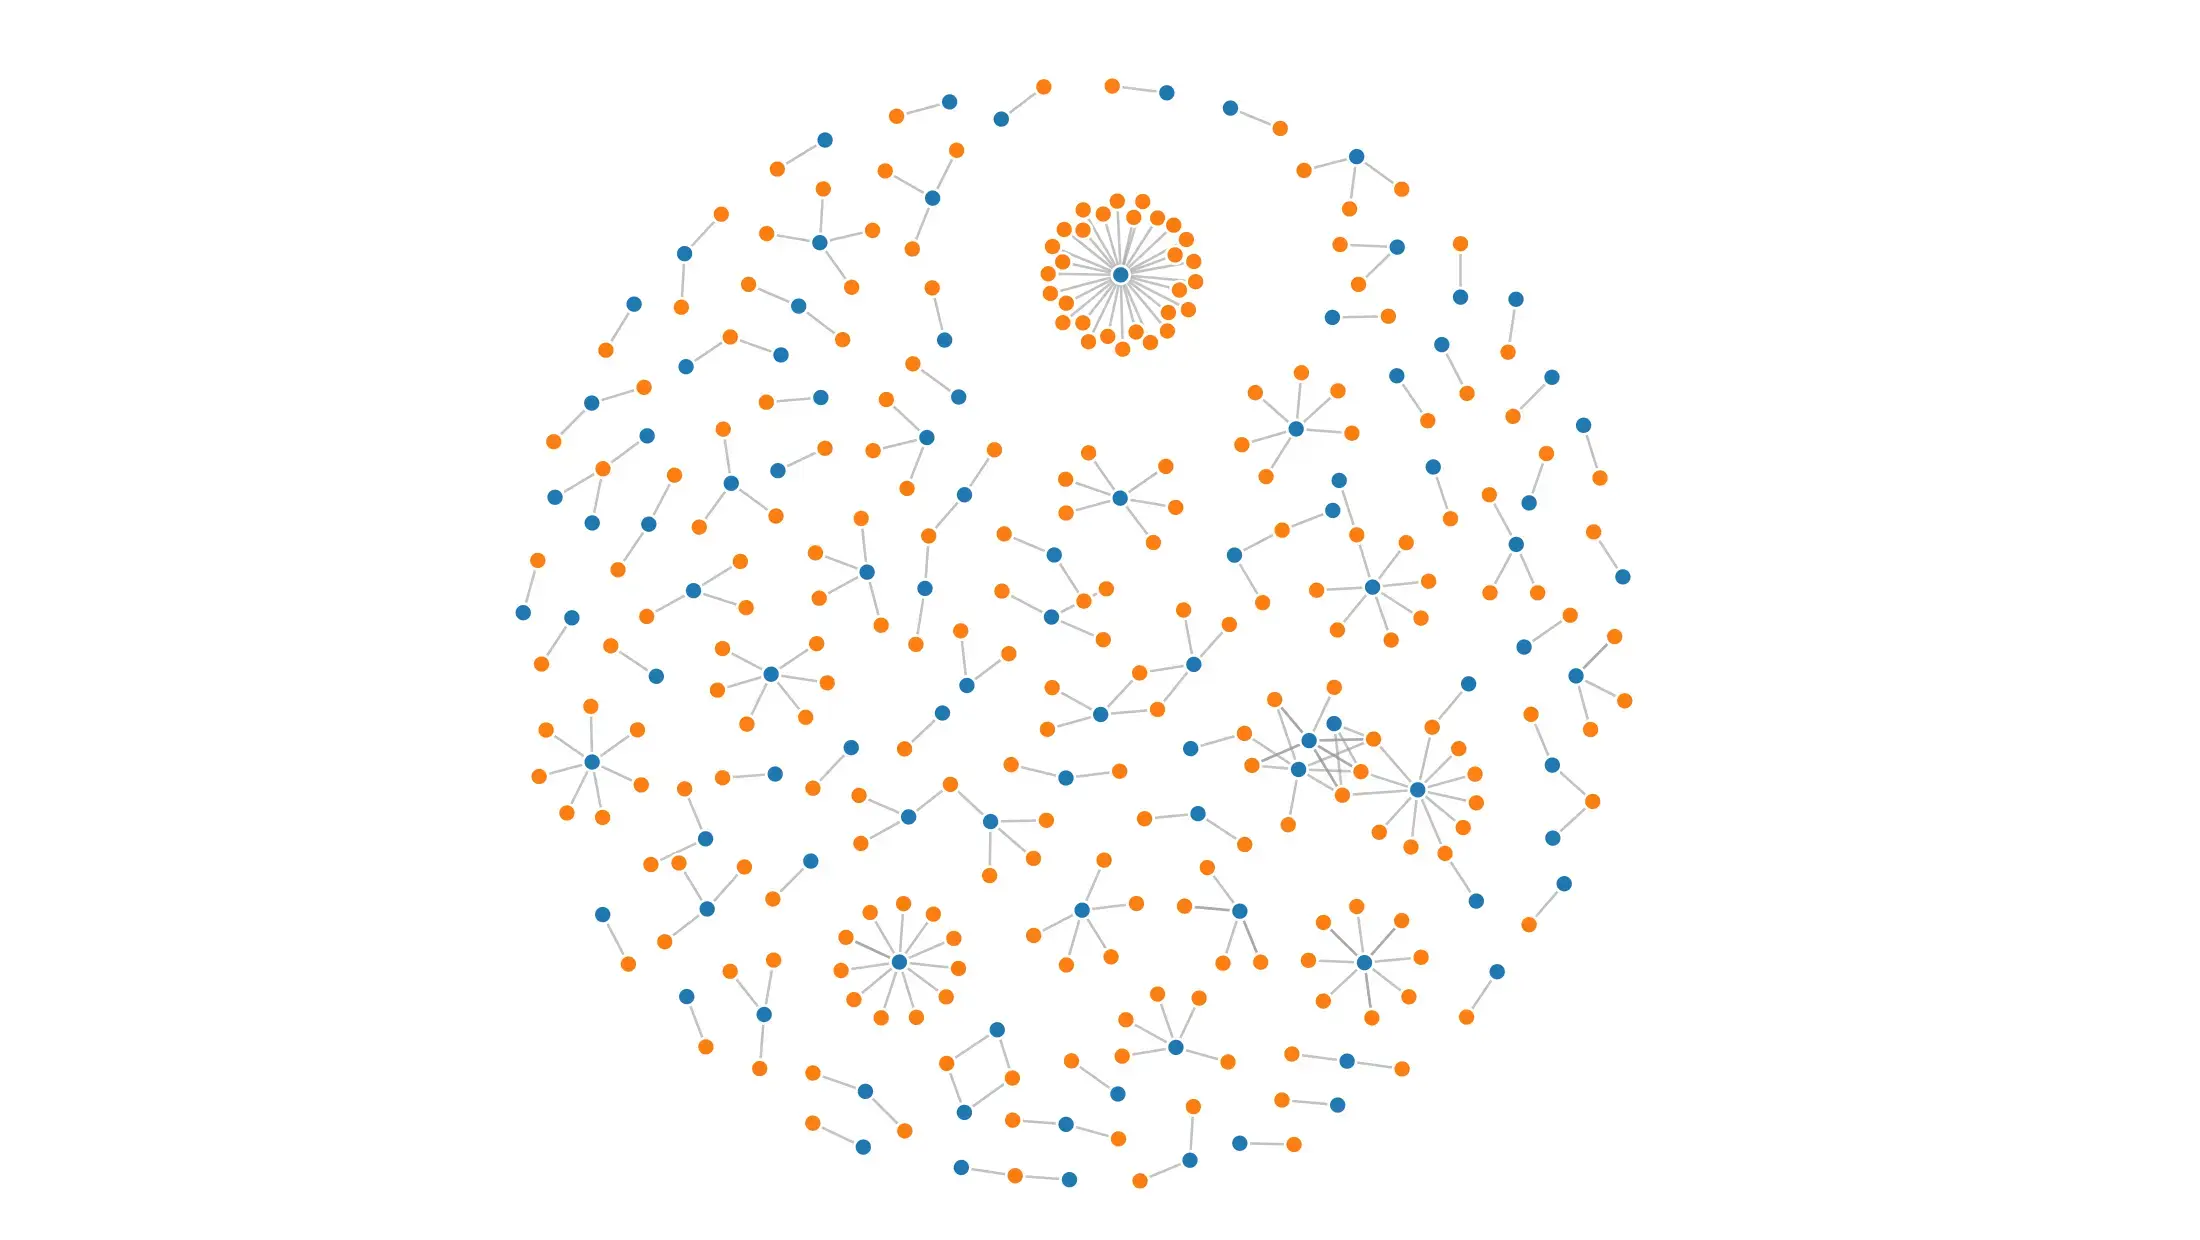
DIAGRAM
Create and design network diagram in Gephi
In this demo, I will show you how to create visualizations from the nodes and edges files in Gephi.
Step 1: Upload the nodes and edges files in Gephi
Once you open Gephi, you’ll see many project options. There are preloaded sample projects you can explore once you know your way around Gephi. For now, we will create a new project.
- Open Gephi and click on New Project.
There are three tabs on the top left side of the screen. We will create the network diagram in the Overview tab, upload our nodes and edges files in the Data Laboratory tab, and export our visualization in the Preview tab.
Let’s work in the Data Laboratory tab.
- Click on the Data Laboratory tab (fig. 1).

Below these tabs, you will see the Data Table tab, which has Nodes and Edges section to upload the files.
- Click on Nodes, and click on Import Spreadsheet, which is on the middle of the same bar as the Nodes tab.
We will have to work with several dialog boxes.
- In the Open dialog box, locate the nodes.csv file, which is inside our working folder: gephi-intro > begin > nodes.csv. Click Open.
- In the Spreadsheet (CSV)… dialog box, click Next and Finish.
- In the Import Report dialog box, select Graph Type: Undirected, and check Append to existing workspace.
This will populate the Nodes table (fig. 2). Scroll down to the end of this Nodes table, and you’ll see that we have 741 nodes.

The process for importing the edges file is the same.
- Click on Edges > Import Spreadsheet.
- In the Open dialog box, locate the edges.csv file, which is inside the same working folder as the nodes file: gephi-intro > begin > edges.csv. Click Open.
- In the Spreadsheet (CSV)… dialog box, click Next and Finish.
- In the Import Report dialog box, select Graph Type: Undirected, and check Append to existing workspace.
According to the end of the Edges table, there are 3574 edges.
Let’s save this file. It’s important that we do this after completing each step. Unfortunately, Gephi doesn’t have an undo button, so saving the file whenever you’re satisfied with your result is necessary. Think of this as a checkpoint that you can return to if you don’t like the steps you took.
- Save the file as networking.gephi: File > Save > select gephi-intro folder > select begin folder > File Name: networking.gephi > Save.
Let’s head over to the Overview tab to create our first network diagram.
Step 2: Create a network diagram
- Click on the Overview tab, which is on the left side of the Data Laboratory tab.
- There is a Layout panel on the left side of the screen (fig. 3). Select Fruchterman Reingold layout: Choose a layout > Fruchterman Reingold > Run.

It will take some time before the simulation stops running. The forces will come to an equilibrium once the algorithm finds the optimal position for the nodes.
- Click Stop once the simulation stops moving.
- There are two magnifying glasses on the bottom left corner of the diagram (fig. 4). Click the one on top called Center on Graph.
- Save the file: File > Save.
The graph should be on the center of the screen and occupy most of the space. If the graph is really small and not on the center of the screen, it most likely means that there are isolated nodes, which can be a problem.

Next, we will change color and size of the nodes and add labels.
- In the Appearance panel (top left side of the screen), click on the Nodes tab, and you’ll see icons for Color, Size, Label Color, Label Size (fig. 5).
- Change the color of nodes to gray color: Nodes tab > Color tab (color palette icon) > Unique tab > Apply.

- Change the size of the nodes based on their degree: Nodes tab > Size tab (ring icon) > Ranking > Choose an attribute > Degree > Min size: 10, Max size: 150 > Apply.
- Change the label size for nodes based on their degree: Nodes tab > Label Size tab (TT icon) > Ranking > Choose an attribute > Degree > Min size: 5, Max size: 8 > Apply. Follow the next step if the node labels do not appear.
- Click on the More Settings pop up icon on the bottom right corner of the figure (fig. 6), then Node Labels > check Show.
- In this More Settings panel, change the font weight too: Node Labels > Font: Arial-BoldMT, 32 > Style: Regular > Ok.
- Save the file: File > Save.

We are ready to export our diagram as an image. Let’s head over to the Preview panel.
Step 3: Export images
- Click on the Preview tab.
- To view the image, click Reset and Refresh. Both buttons are at the bottom of the screen.
Let’s change the following settings for the visualization:
- Below the Preview Settings tab (top left of the screen), open the menu and select Default.
- The Settings tab just below that menu bar has the following sections: Nodes, Node Labels, Edges, Edge Arrows, Edge Labels.
- In Node Labels, check Show Labels, uncheck Avoid label overlap (fig. 6). Uncheckigng Avoid labels overlap prevents Gephi from hiding overlapping labels.
- In Edges, check Rescale weight.
- Click Refresh.
Your figure should look like this (fig. 7).
- You can save these settings for future use. Click Save preset (save icon on the top right corner of the current Preview Settings panel) > Name: demo > Ok.
- Save the file: File > Save.

We are ready to export the graphic either as a PNG file or a PDF file.
- Go to the Export option at the bottom left of the screen, click on SVG/PDF/PNG. In the dialog box, Save In > select gephi-intro folder > begin folder > Files of Type: PNG files > File Name: networking-paper.png. Click on Options… In this dialog box, change Width 7200 > Height 5400 > Ok. Click Save.
This will save the picture in 4:3 aspect ratio (7200 x 5400 px), which is good for embedding the image in a document. Let’s save the picture again, but with a 16:9 aspect ratio (7680 x 4320 px) and different name, networking-web.png, which we can use for websites.
- Go to the Export option at the bottom left of the screen, click on SVG/PDF/PNG. In the dialog box, Save In > select gephi-intro folder > begin folder > Files of Type: PNG files > File Name: networking-web.png. Click on Options… In this dialog box, change Width 7680 > Height 4320 > Ok. Click Save.
The image in 16:9 aspect ratio looks like this (fig. 8).

Let’s export the image in PDF format as well. If you know graphic design software like Adobe Photoshop or Affinity Studio, PDF format is more useful than PNG.
- Go to the Export option at the bottom left of the screen, click on SVG/PDF/PNG. In the dialog box, Save In > select gephi-intro folder > begin folder > Files of Type: PDF > File Name: networking.pdf. Click on Options… In this dialog box, change Top 2 > Bottom 2 > Left 1 > Right 1 > Ok. Click Save.
- Save the file: File > Save.
In this post you learned about most of the settings for creating and designing your network diagram. Go back to the Overview tab to play around with the design options. If you don’t like the changes, you can simply quit and re-open the networking.gephi file to return to the last saved checkpoint.