Diagrammatic Readings
Computational and materialist approaches to literary analytics and visualization
WITH DIAGRAMS FOR
NETWORK,
TEXT,
SOUND,
AND MORE...
✻✻✻
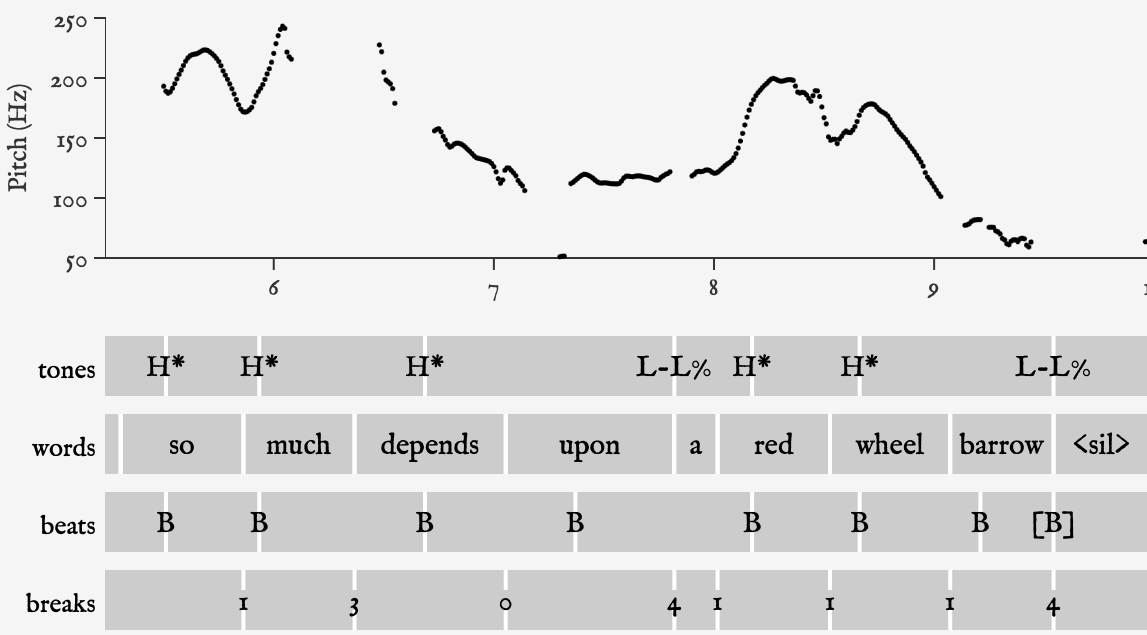
RhythmThough verse rhythm is often associated with repetition and regularity, it is shaped more deeply by the alternation of tones and the variation of phrasing. This calls for a prosodic model that combines empirical precision and musical sensitivity.
✻
Why Diagrams?
Digital and computational tools we use for analytics of aesthetic content are typically not developed to model its matter and form. When borrowing from technical and scientific domains, how might we adapt these tools to model artistic practices?
More specifically, as researchers across the humanities and arts are increasingly turning to these tools, how might we repurpose them for humanistic research?
Digital humanists and data science scholars have proposed methods such as pursuing novel algorithms to model cultural objects, 1 building mixed-methods research frameworks, 2 or advancing critically informed analytical practices. 3
We take cue from Johanna Drucker, who suggests that these interventions should be made on the diagrammatic plane.
An act of creating an inflection, adding an attribute, or making a change in a graph would feed back into the structured data. This would create data and could also intervene in the formal structures of the data, even changing its structure.
~ Johanna Drucker 4
In fig. 1, Drucker gives a sketch of “creating an inflection” on the network graph. According to the top right figure, more than one centrality measurements could be rendered on each node, e.g., shading for degree centrality, brightness for eigenvector centrality, and glow for betweenness centrality.

Here, Drucker is proposing a comparative approach to analytics, namely, how does the node behave in a network when rendered with different centrality measurements? AlthoughDrucker's sketch is not practically feasible––the nodes will be visually cluttered if all three measurements are rendered at once, but more about this later––it still illustrates the virtuality of graphical expressions.
✻
Materials and forces of graphical expressions
The graphical expressions turn matter and form of content into materials and forces, and we propose a diagrammatic approach that renders these materials and forces visible.
| Matter | Form | |
|---|---|---|
| Content | person and place | inclusion and exclusion |
| Expression | co-presence | closeness and betweenness |
As we repurpose these techniques for humanistic research, what are the affordances of “creating an inflection, adding an attribute, or making a cange in a graph” for modeling aesthetic content?